
NACA 0012 at 10°: Loads, Pressure and Convergence
A steady airfoil result links surface pressure to exported loads, while separating a stable force history from a stricter residual target.
01
What can this baseline support?
The engineering task is to establish an inspectable baseline before comparing airfoil changes. At 10° incidence, the final exported lift coefficient is 1.10403 and drag coefficient is 0.0127666. These are results from one operating condition, not evidence of a design improvement. Pressure distribution identifies where to examine loading; iteration history limits how confidently small differences can be interpreted.
02
Conditions and reference quantities
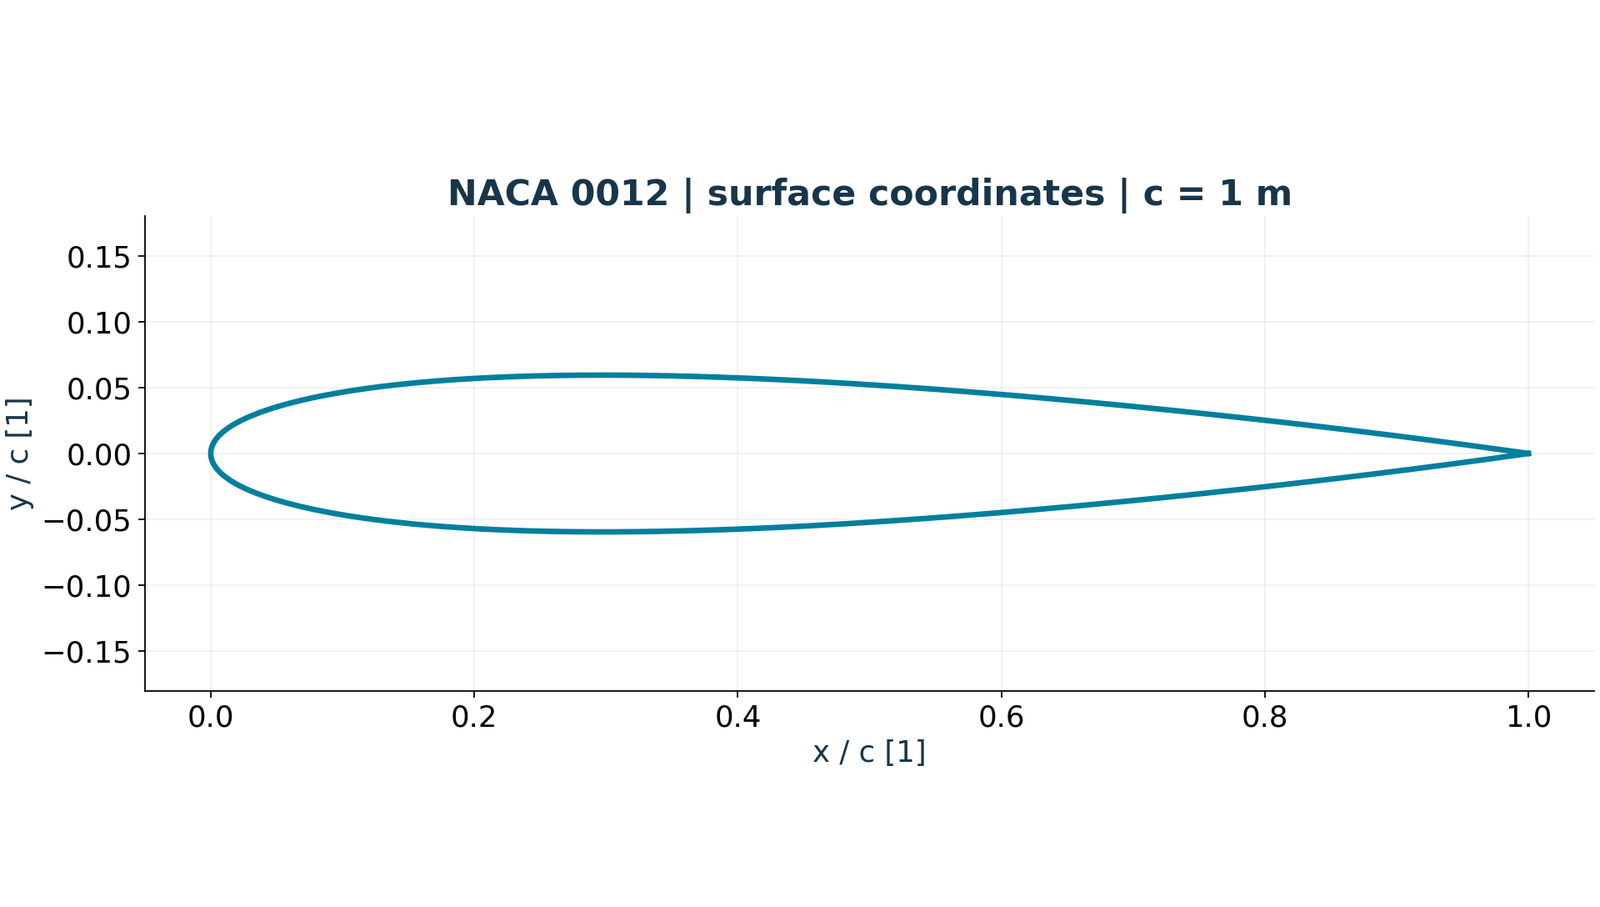
The run configuration and execution log agree on Mach 0.15, Reynolds number 6,000,000 and 10° incidence. The calculation uses two-dimensional compressible RANS with the SA turbulence model. Chord and reference length are 1 m; reference area is 1 m² for the unit-span model. The wall is adiabatic. The result summary reports 229,376 cells and a maximum y+ of 0.652; that near-wall diagnostic alone does not establish grid independence.
03
Read the pressure loading along the chord
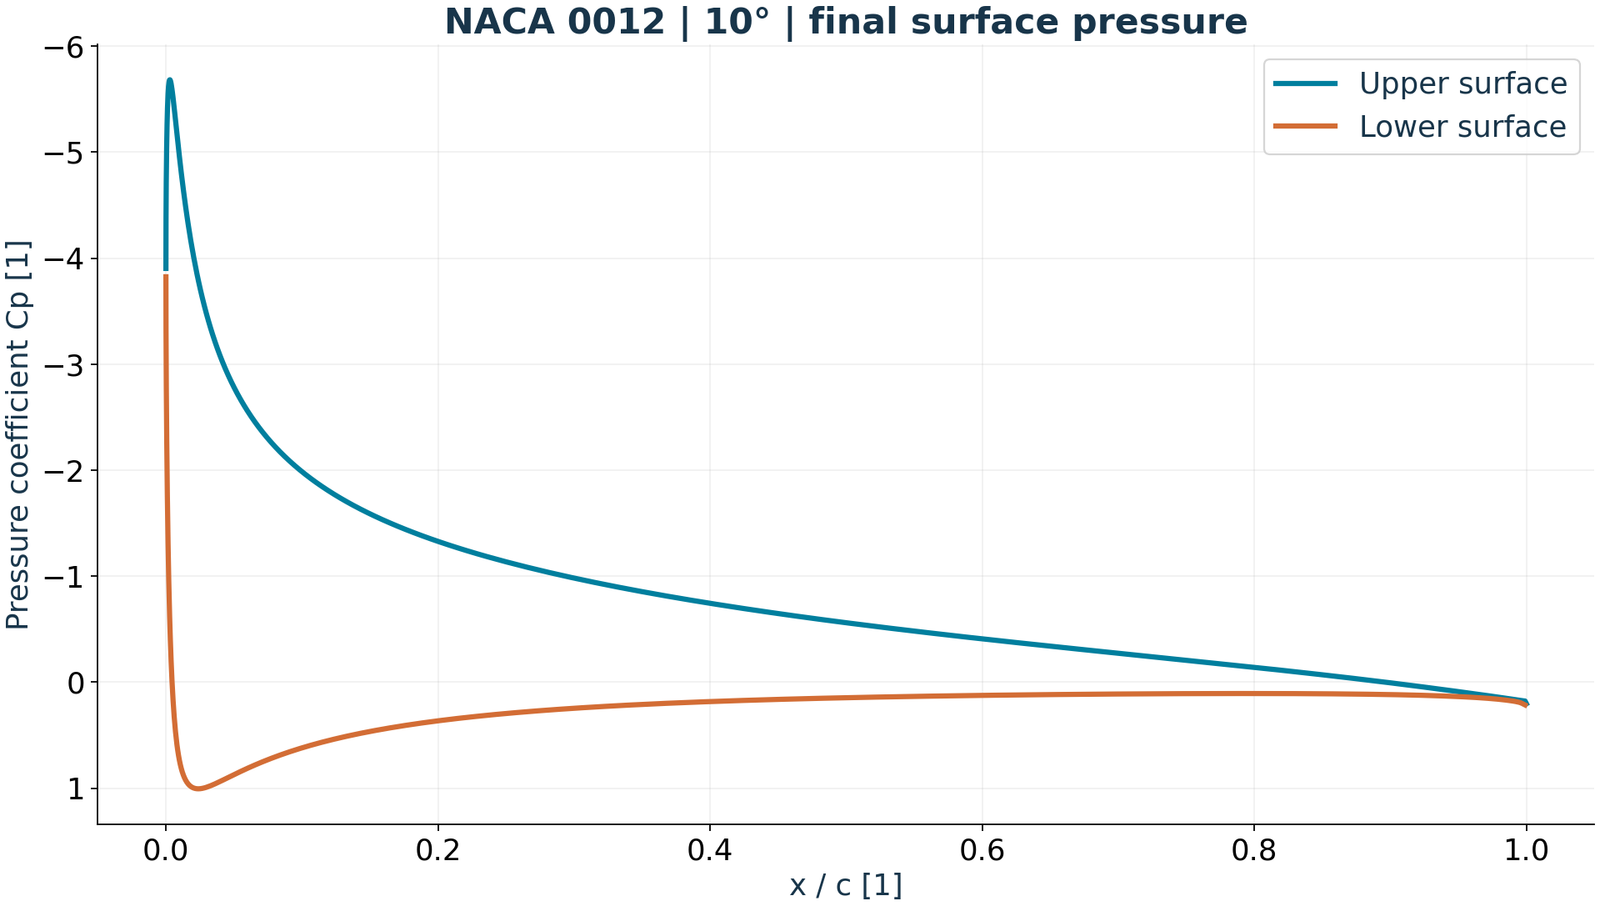
The final surface CSV shows a more negative pressure coefficient on the upper surface near the leading edge, followed by recovery downstream. The upper and lower surface traces provide a direct way to locate the pressure difference. Cp is dimensionless, and the vertical axis is inverted so lower pressure appears higher. The plot represents a single final field, not a time sequence. This makes the leading-edge region a useful focus for subsequent mesh and pressure checks; it does not quantify a local drag contribution.
04
Stable loads still need a stated window
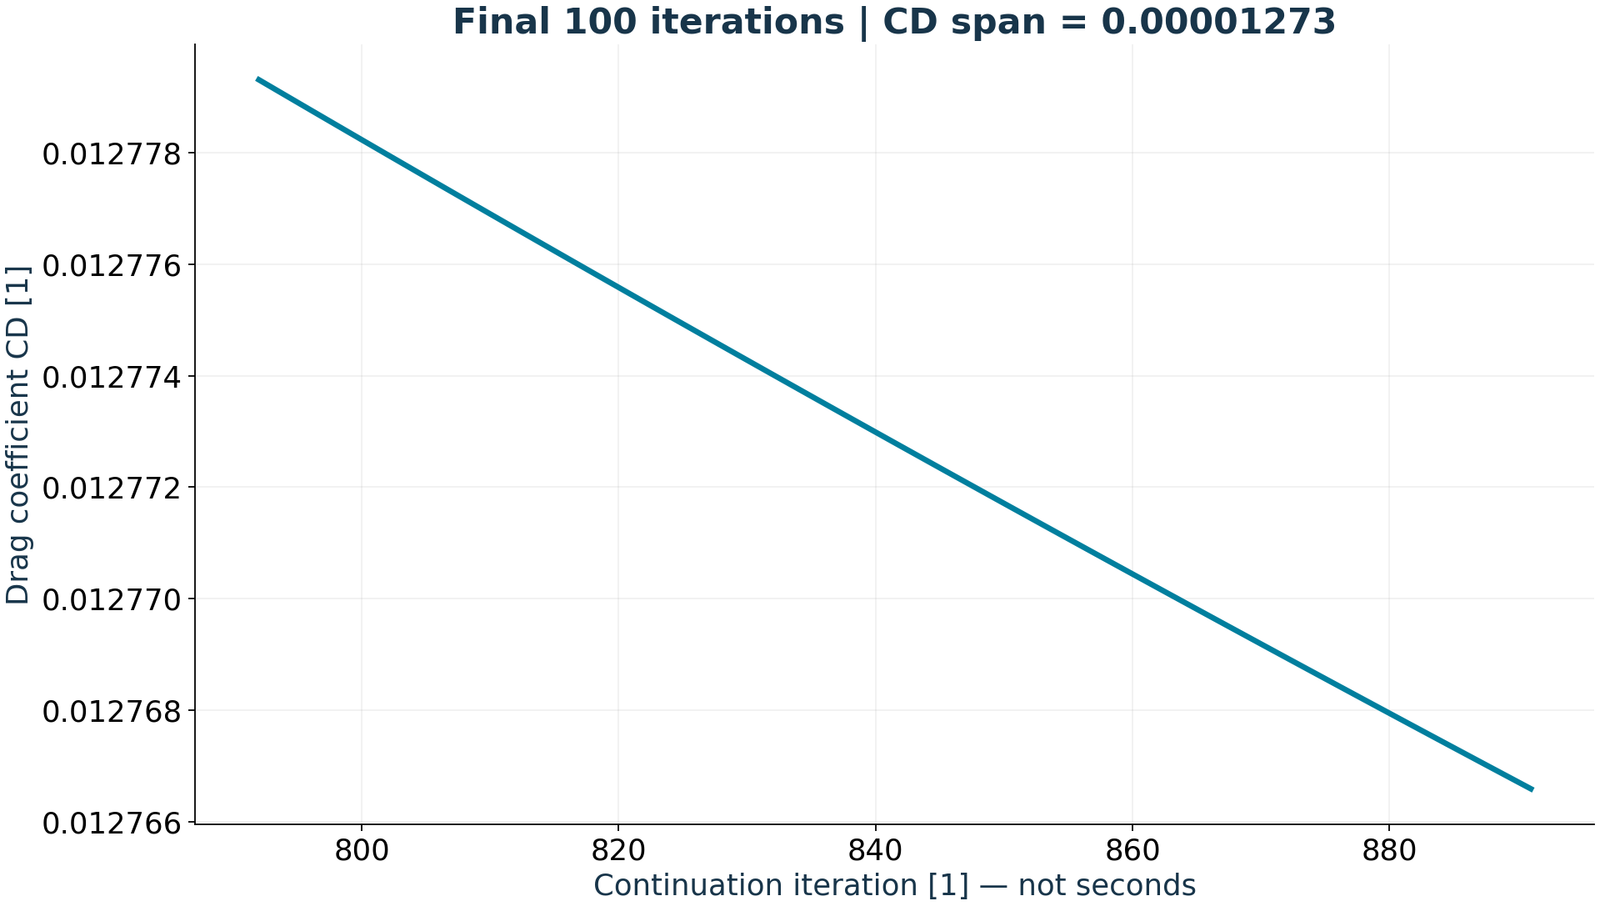
The final exported coefficients are CL = 1.10403 and CD = 0.0127666. Over continuation iterations 792–891, the recomputed peak-to-peak spans are 0.00011284 in CL and 0.00001273 in CD. A span is max minus min over these 100 samples: it is neither a confidence interval nor a discretization-error estimate. The drag trace is still drifting downward within this small range. The horizontal axis counts iterations, not seconds.
| Metric | Final | Final 100 span |
|---|---|---|
| CL | 1.10403 | 0.00011284 |
| CD | 0.0127666 | 0.00001273 |
05
Two stopping criteria give different answers
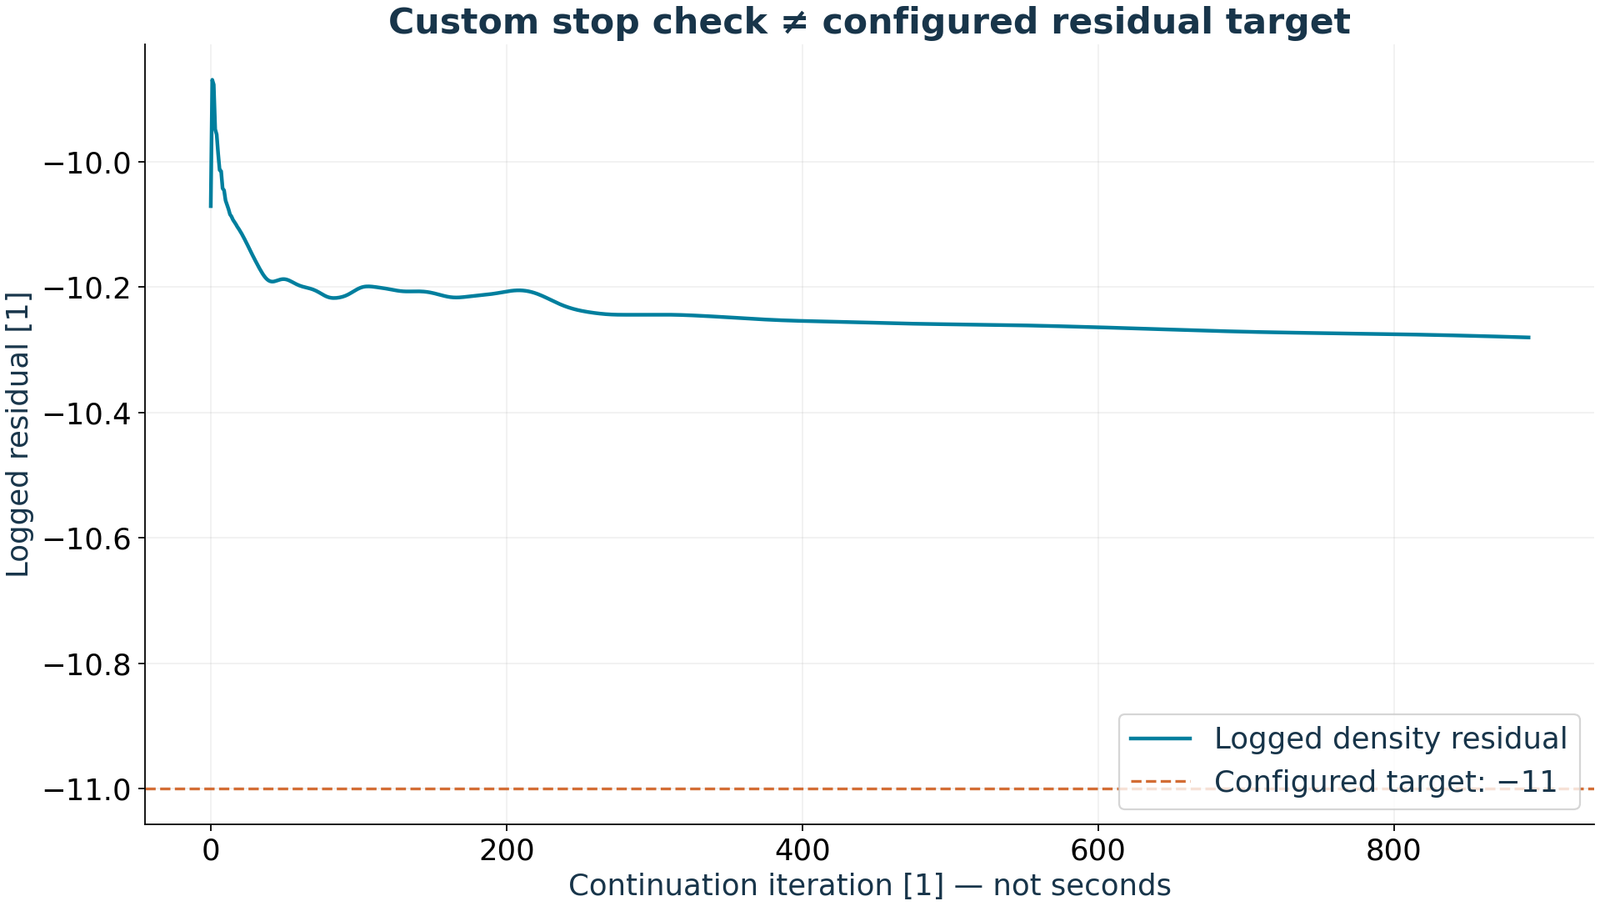
The custom stop record reports that its numerical checks were satisfied. However, the final density residual is −10.2805 while the configured target is below −11. The detailed log table marks that target as unmet, despite a generic success message. We therefore report completion under the custom stop rule and retain the stricter residual limitation. The project report also says grid independence has not been established; no new experimental validation was performed for this article.
06
Use this result as a baseline with explicit limits
Keep the operating condition, reference quantities and iteration window fixed when comparing later candidates. Before interpreting a small drag difference as a geometry benefit, complete the residual check and quantify mesh sensitivity. Surface pressure and the exported coefficients offer a useful baseline now; they do not yet justify an optimized-airfoil claim or an uncertainty bound.
Syntrivora
Build a comparable aerodynamic baseline
Start with the operating conditions and validation scope.