
Formula Car Aerodynamics: Downforce, Drag and Wake
A 120 km/h baseline connects exposed-wheel wakes and aerodynamic surfaces with integrated loads and iteration-window sensitivity.
00 / CONTEXT
Why the complete vehicle matters
The front wing, exposed wheels, side body and rear wing share a coupled flow field. A local acceleration or a visually strong vortex cannot identify the force contribution of that part. The useful baseline combines spatial evidence with integrated drag and vertical load.
Where should the next geometry study focus, and how much confidence should be placed in the current drag and downforce baseline?
- Configured speed
- 120 km/h
- Final-window mean drag
- 938.54 N
- Final-window mean lift
- −621.24 N
- Monitor samples
- 500
Race-car assessment must consider downforce together with its drag cost. Negative integrated lift describes a downward resultant, but does not directly establish axle balance, tire grip or lap time. This study first establishes a traceable baseline, then turns spatial observations into questions for the next design comparison.
01 / METHOD
Steady analysis at a configured 120 km/h
The current run configuration specifies incompressible steady RANS. The historical folder label is not the method definition. An available log records completion, but the table describes the current configuration and completion is not an accuracy validation. Aerodynamic coefficients are reported as exported.
- Speed
- 120 km/h · 33.33 m/s
- Incidence / sideslip
- 0° / 0°
- Density
- 1.225 kg/m³
- Reference area / length
- 1.9101 m² / 5.5912 m
- Configured Ma / Re
- 0.098 / 1.275×10⁷
- Statistics window
- Iterations 1,501–2,000; final 25%
Ground motion, wheel rotation and ride height affect floor and wheel-region flow; their executed settings have not been fully confirmed here. The results describe this numerical baseline rather than a demonstrated road or track condition. Subsequent comparisons must fix those boundaries and confirm force-integration surfaces and axis directions.
02 / FLOW FIELD
Exposed wheels reshape the downstream flow
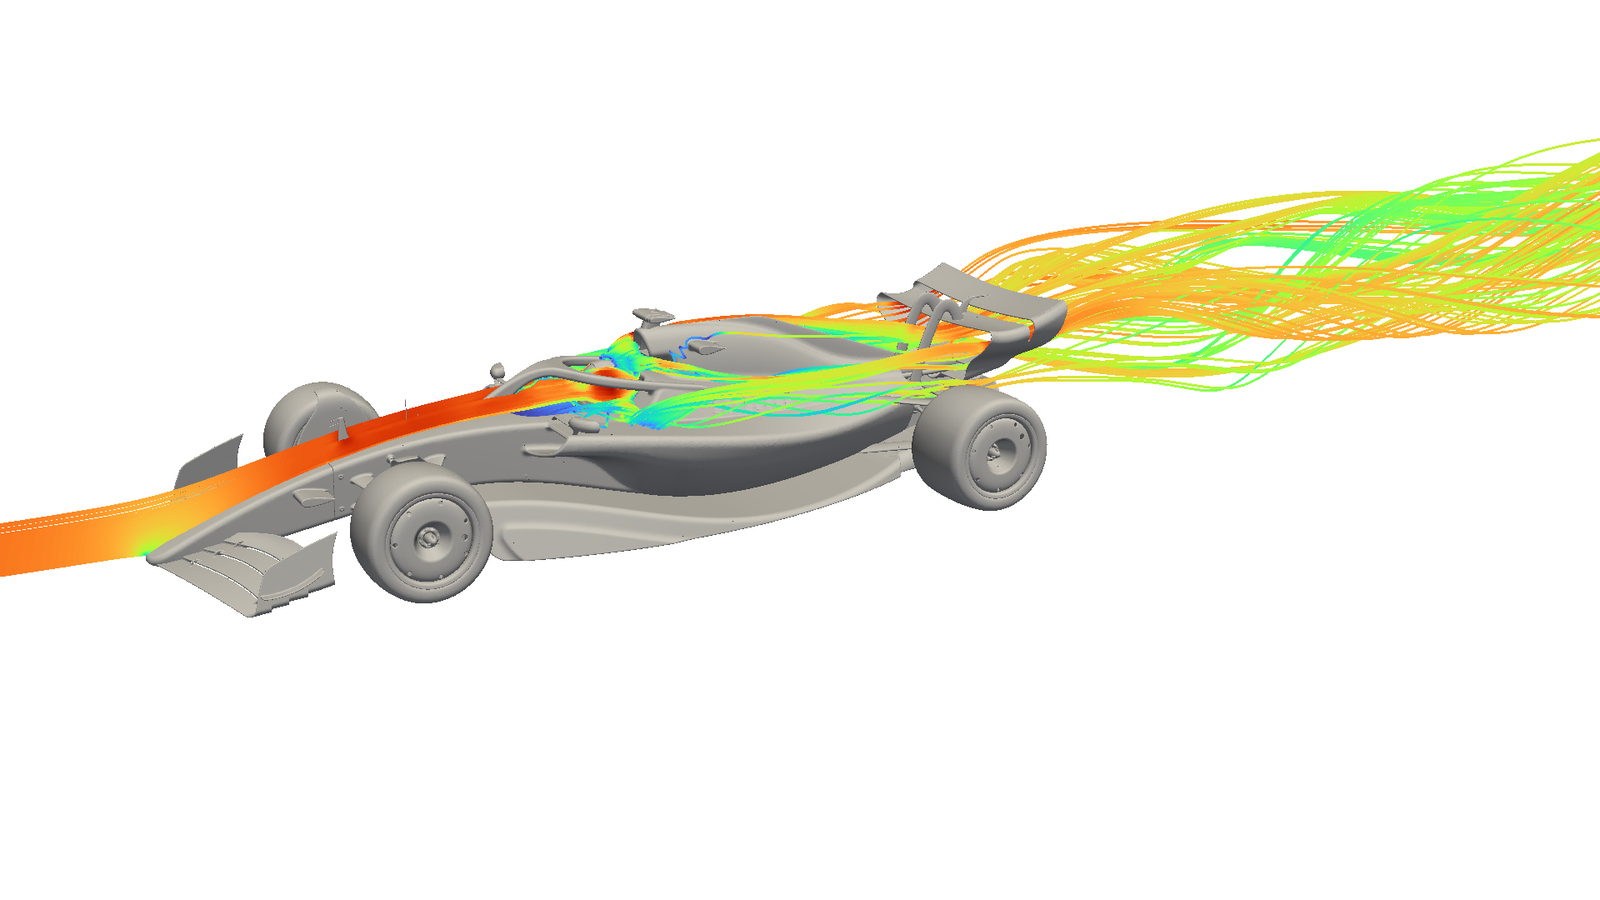
The full-vehicle streamlines trace paths along the nose, around the cockpit and toward the rear, with visible deflection near the rear wing and wake. They establish spatial relationships between components. This rendering has no readable numerical scale, so its colors are not used to estimate local speeds or drag contributions. Static streamlines are not time-resolved particle trajectories.
The horizontal section shows blue-green low-speed bands behind the wheels and a central velocity deficit extending downstream of the body. The selected section uses a velocity scale of approximately 0–53 m/s; white regions are geometry intersections. Wheel wakes and the central wake are spatially distinct, so the next study should compare their widths, recovery and left-right differences at fixed downstream stations. Velocity magnitude alone cannot establish reverse flow.
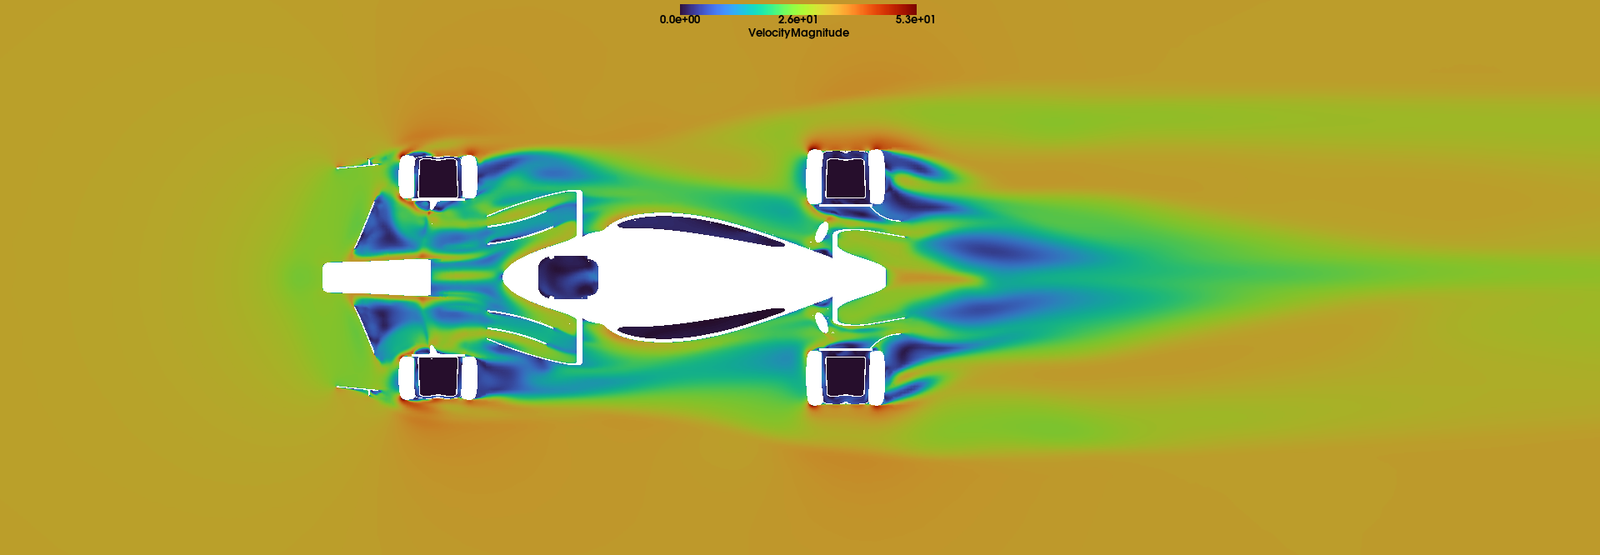
A testable next question is whether front-wing or wheel-region changes improve rear inflow while reducing total drag or retaining the required downforce. A visually cleaner local flow does not establish a better design.
03 / LOADS
Read downforce together with drag cost
Across the final 500 iterations, mean drag is 938.54 N and mean lift is −621.24 N. Under the +Z lift convention, the negative value indicates a downward resultant. The RMS below measures iteration-to-iteration deviations from the window mean; it is not physical unsteadiness, measurement error or a confidence interval.
| Load | Mean / N | Iteration RMS / N | Exported coefficient |
|---|---|---|---|
| Drag | 938.54 | 5.19 | Cd = 0.7222 |
| Lift | −621.24 | 12.33 | Cl = −0.4780 |
The ratio of mean downforce magnitude to mean drag is approximately 0.662. It characterizes this baseline, not an optimized aerodynamic efficiency. Combining drag with the configured speed gives an aerodynamic power scale P = D × U of approximately 31.28 kW, excluding rolling resistance and powertrain losses. Both derived quantities depend on the current load definitions and are not lap-time predictions.
A component report cannot replace the full-vehicle force. The available body-group mean drag is 120.17 N, compared with 938.54 N for the vehicle; their integration surfaces differ. Until surface membership is audited, the difference is not assigned to wings or wheels and is not presented as a component drag breakdown.
04 / EVIDENCE
Final loads still depend on the iteration window
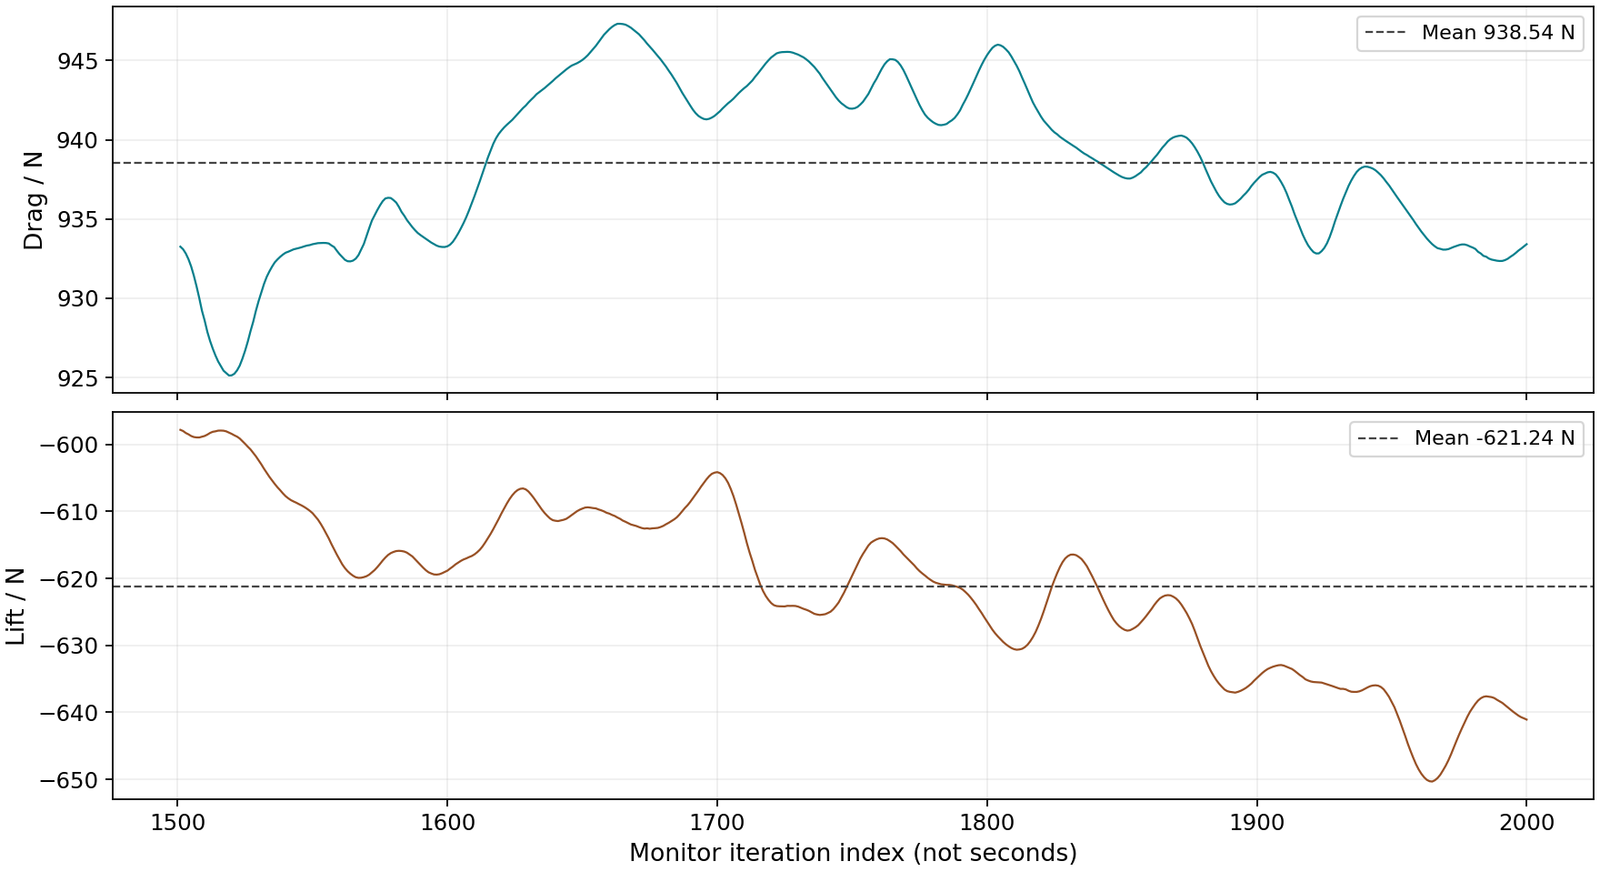
These curves use all 500 samples in the final quarter of the original force CSVs, without smoothing. The horizontal axis is monitor iteration index, not seconds; dashed lines show window means. The curves reveal late-stage drift and numerical variation, not vortex-shedding frequencies.
| Final fraction | Samples | Mean drag / N | Mean lift / N |
|---|---|---|---|
| 10% | 200 | 937.29 | −633.03 |
| 25% | 500 | 938.54 | −621.24 |
| 50% | 1,000 | 925.26 | −631.26 |
The final 10% and 25% windows differ by about 1.25 N in mean drag but 11.79 N in mean lift. Expanding to the final 50% lowers mean drag by about 13.28 N. Different metrics stabilize at different rates; apparently stable drag does not establish convergence of every load. Extend iterations and examine residuals, conservation errors and consecutive-window means before fixing the baseline.
Scope of evidence
This is a single-condition numerical baseline. No mesh independence, time-step study, wind-tunnel comparison or geometry improvement is established.
05 / DESIGN
Advance the next design study under comparable conditions
01
Front wing and wheels
Check whether wheel-wake changes correlate with total drag and inflow to rear components.
02
Floor and rear wing
Compare downforce and drag at fixed ride height and ground boundaries; establish component loads and moments before discussing axle balance.
03
Stabilize the baseline
Use consecutive windows, mesh comparisons and boundary checks to judge whether differences are credible before selecting a geometry change.
Source basis
Based on existing field exports, run configuration, completion log and original force monitors for this model. Statistics were independently reproduced from the CSVs; this validates data preparation, not simulation accuracy or real-vehicle performance.
Comparing aerodynamic concepts?
Connect local flow changes to vehicle-level loads.
Build a reviewable comparison with consistent conditions, meshes and load definitions.